Get the first traces and metrics from a Node.js service into Sherlock in about ten minutes.
This page takes a Node.js service with no telemetry to first data in Sherlock. The full path, with the from-code start, deployment, and verification, is in End-to-end steps.
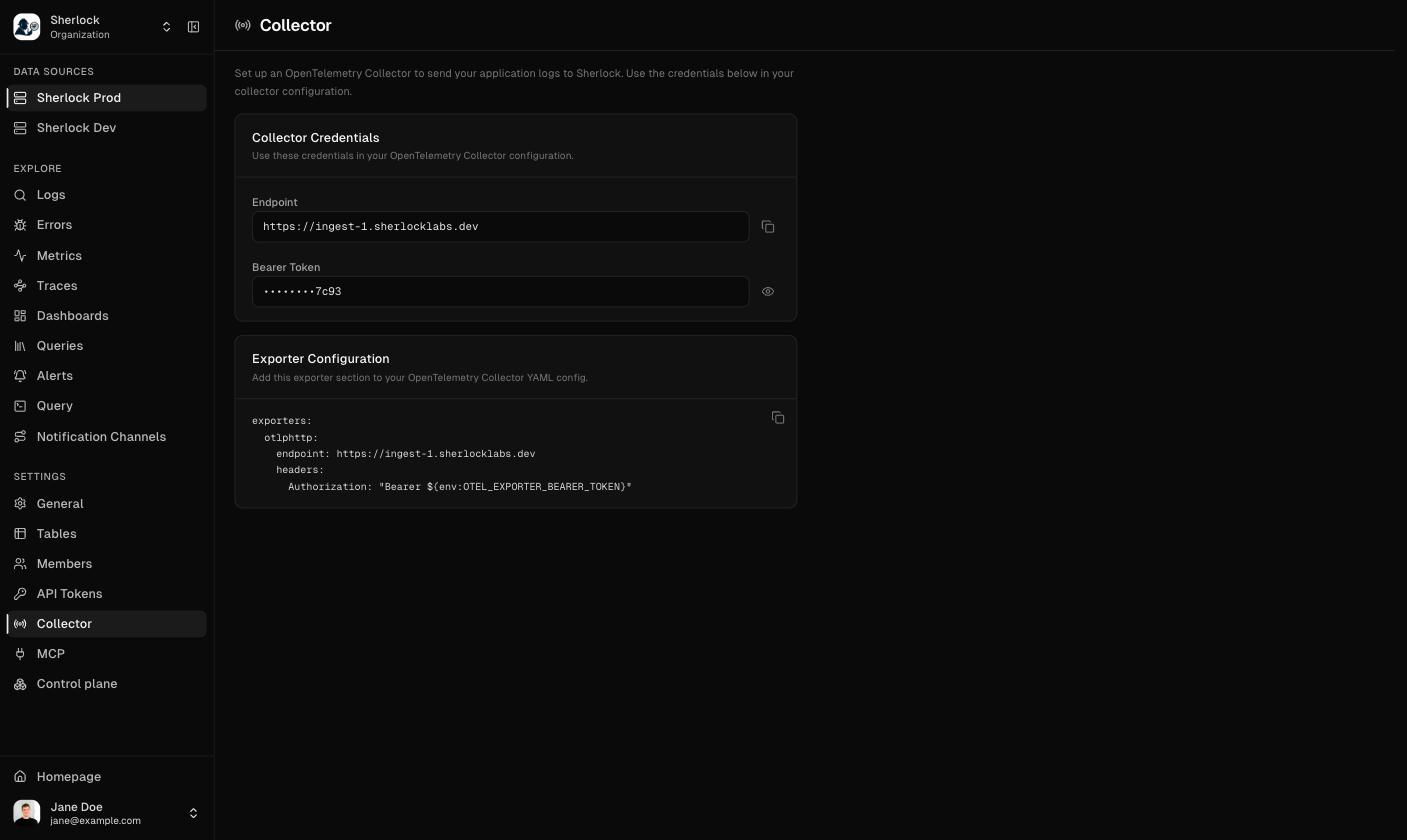
In Sherlock, open Settings and then Collector. The Collector Credentials card shows two values.
Endpoint. Click the copy button.
Bearer Token. Click Reveal, then copy it.
Decide the value of the env attribute for this service, for example prod or staging. Sherlock routes data into a source by this value.
Settings → Collector → Collector Credentials
2
Install the package
npm install @sherlock-labs/otel
The package needs Node.js 20 or later, and 20.6 or later for ES modules. It brings its own OpenTelemetry dependencies. Do not add @opentelemetry/* packages yourself. Type definitions are included.
The SDK is in alpha. Until the package is on a public registry, Sherlock provides it as a tarball. Put the tarball in your repository, point the dependency at it, and run npm install again:
The SDK patches libraries at the moment they load, so it must load first. How depends on your module system.
ES modules
CommonJS
Your entry is .mjs, or package.json has "type": "module". A line-1 import is not enough here: static imports are linked before any code runs, so the patches would arrive too late. Register a loader hook with --import instead.Create otel.mjs next to your entrypoint:
// otel.mjsimport { register } from 'node:module';register('@opentelemetry/instrumentation/hook.mjs', import.meta.url);await import('@sherlock-labs/otel/register');
Run your app with it, and put the same command in your start script:
@opentelemetry/instrumentation is installed with the SDK. You do not add it. In a container, set NODE_OPTIONS="--import ./otel.mjs" instead of changing the command.
Your entry is .cjs, or package.json has no "type" field. TypeScript with module: NodeNext and no "type" emits CommonJS. Add one line as the first line of your entrypoint:
// index.js — line 1, alwaysrequire('@sherlock-labs/otel/register');const express = require('express');// the rest of your app
A library that loads before this line is never traced, and nothing warns you. If you bundle your app, check the built output.
Registering installs the patches. They record nothing until the pipelines start.
The register entry starts the pipelines on its own when it finds SHERLOCK_ACCESS_TOKEN and OTEL_SERVICE_NAME. There is no code to write.The SDK ships with a default endpoint. Compare it with the Endpoint on Settings → Collector, and set SHERLOCK_ENDPOINT to that value when they differ.
5
Send some requests
Hit a few routes of your service.
curl http://localhost:3000/hello
6
See the data in Sherlock
Traces. Open Traces. Your service name appears within about five seconds. Spans leave in batches, so keep the app running. A process that exits without stop() drops the pending batch. Open a trace to see the request and its spans.
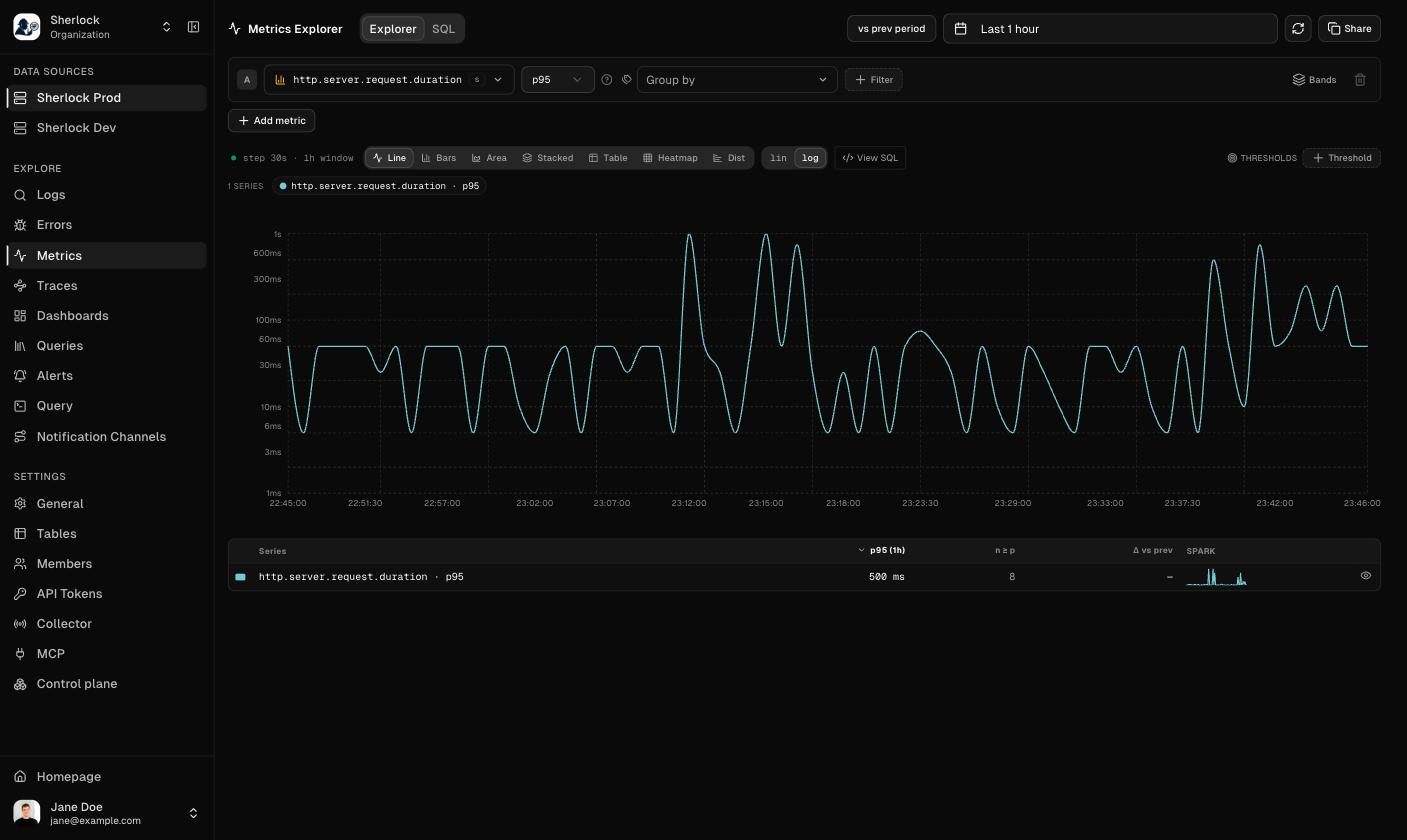
Metrics. Open Metrics. http.server.request.duration appears after the first export interval, 30 seconds by default. The catalog refreshes every 60 seconds, so allow about a minute.
Logs. If your service logs with pino, each line written inside a request now carries trace_id, span_id, and trace_flags. The SDK does not ship logs. Ship and correlate logs shows the two ways to send them.
This Express app is the quickstart plus one custom histogram with an exemplar and a clean shutdown. Save it as app.mjs next to the otel.mjs preload from step 3 and run node --import ./otel.mjs app.mjs.
// app.mjs — registered through --import ./otel.mjs, so no register import hereimport { defineMeter, stop } from '@sherlock-labs/otel';import { applyMetricsMiddleware } from '@sherlock-labs/otel/express';import express from 'express';const m = defineMeter('app');const workDuration = m.histogram('app.work.duration'); // unit s, seconds bucketsconst app = express();app.use(applyMetricsMiddleware()); // app.http.server.count / .errors / .durationapp.get('/hello', (_req, res) => { res.json({ hello: 'world' });});app.get('/work', async (_req, res) => { const jobId = `job-${Math.round(Math.random() * 1e6)}`; const startedAt = performance.now(); await new Promise((resolve) => setTimeout(resolve, 100 + Math.random() * 200)); const seconds = (performance.now() - startedAt) / 1000; // 2nd argument: low-cardinality metric attributes. // 3rd argument: high-cardinality exemplar attributes. workDuration.recordWithExemplar(seconds, { kind: 'report' }, { jobId }); res.json({ jobId, seconds });});const server = app.listen(3000);process.on('SIGTERM', async () => { server.close(); await stop(); // flushes the last metric interval and the pending span batch process.exit(0);});
Look at the first lines of your process output. With no token, the SDK logs one line and stays off:
[otel] sherlock: no access token (SHERLOCK_ACCESS_TOKEN) — telemetry stays off
A rejected token shows at the default log level as an export failure whose message ends in Unauthorized. Compare the token with Settings → Collector. OTEL_LOG_LEVEL=debug shows every export attempt.
Bare GET spans, and no http.route on the HTTP metric
The app is an ES module and the SDK was registered with an import instead of the --import preload. Go back to step 3.